Main Study
Effective Main Study
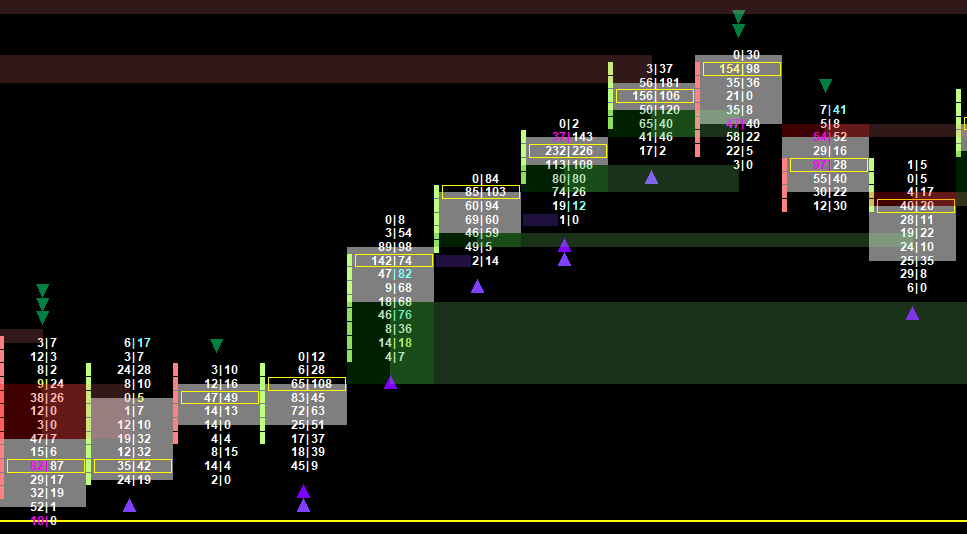
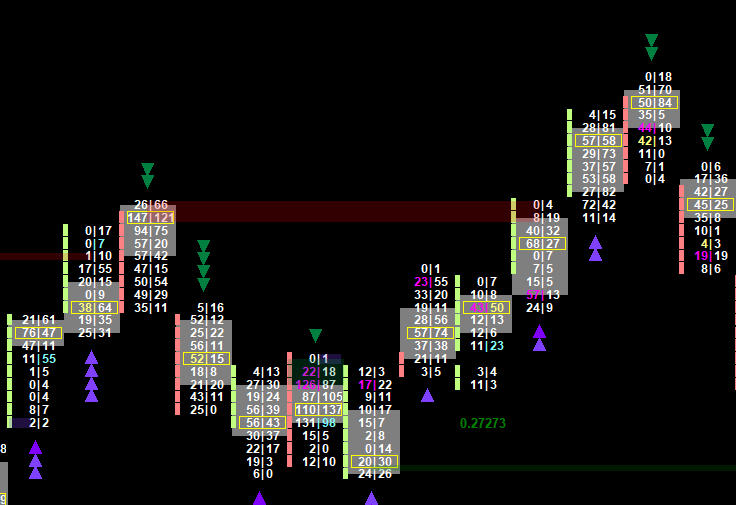
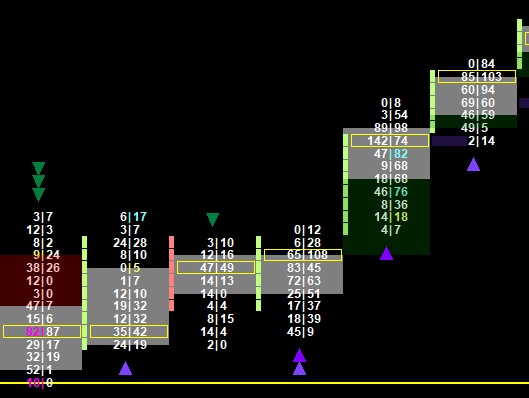
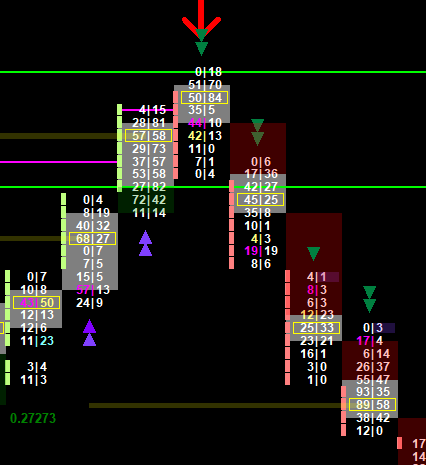
The Effective Main Study is a comprehensive footprint analysis tool that identifies key market structure patterns and order flow signals in real-time. This study provides visual subgraphs for exhaustion detection, volume imbalances, POC analysis, and momentum identification.
Quick Navigation
- Settings - Configuration options
- POC Analysis - Point of Control patterns
- Volume Analysis - Volume-based signals
- Order Flow - Bid/Ask imbalances
- Market Structure - Gaps and momentum
Settings
Select Numbers Bar Calculated Values study
IN5: Effective Main Study depends upon Numbers Bar Calculated Values. Supply the StudyID of it.
Display Value Area Gap Extension
Subgraphs
Exhausted_Sellers, Exhausted_Buyers,
Identifies market exhaustion points where buying or selling pressure significantly diminishes. In bullish bars, exhausted sellers are detected at the lowest bid price level when number of trades is below the threshold. In bearish bars, exhausted buyers are identified at the highest ask price level.
The configurable Exhaustion Threshold (default: 6) determines the minimum number of trades required at these critical levels. This pattern often signals potential reversals as the dominant market participants lose momentum at key price extremes.
BarBidAskImbalanceUp, BarBidAskImbalanceDown
Detects significant bid/ask volume imbalances at the entire bar level using a configurable threshold ratio (default: 0.66). When bid/ask ratios reach 2:1 or greater, this often indicates strong directional pressure and potential market movement. These imbalances help identify when one side of the market is overwhelming the other, providing early signals for trend continuation or momentum shifts.
PriceLevelBidAskImbalanceUp, PriceLevelBidAskImbalanceDown
Detects bid/ask imbalances at individual price levels within a bar. Useful for identifying specific levels where order flow shifts occur.
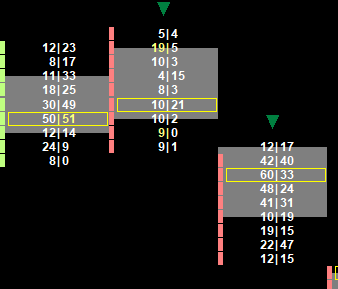
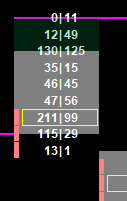
SlingShotPocUp, SlingShotPocDown,
For bullish slingshot POC, two green bars, where the 2nd bars Point of control is lower than the first bar POC. For bearish slingshot POC, two red bars, where the 2nd bars Point of control is higher than the first bar POC.
PairedPoc
Detects when two consecutive bars share the same Point of Control price level, creating strong support/resistance zones. These synchronized POC levels indicate where the maximum volume traded at the identical price across multiple bars, often marking significant areas where price may react or consolidate in future trading.
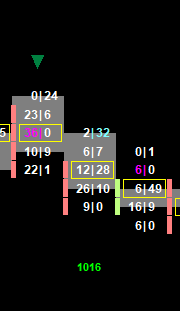
PocWaveUp, PocWaveDown,
A 3 bar setup. For a bullish Point of Control Wave, first bar is red, second bar and third bars are green. 2nd bar POC is lower than first and 3rd bar POC is higher than first bar POC. For a bearish POC Wave Down, it is the reverse.
ZeroPrintUp, ZeroPrintDown
Detects price levels with zero volume (no prints), indicating potential support/resistance zones where price may react.
ProminentPocBullish, ProminentPocBearish,
Identifies Point of Control levels positioned within a configurable number of price levels from the bar’s edge (default: 1 level from top or bottom). These prominent POC levels indicate significant volume concentration near price extremes, suggesting strong support/resistance zones where major participants established positions. The proximity to bar edges often signals potential reversal or continuation points with high probability.
UntestedValueAreaProminentPocUp, UntestedValueAreaProminentPocDown
Combines prominent Point of Control analysis with untested value area identification to mark high-probability zones where price may return. These levels represent significant volume concentrations near bar extremes that have not yet been revisited by subsequent price action, creating strong magnetic zones for future price interaction and potential reversal or continuation patterns.
EngulfingValueAreaUp, EngulfingValueAreaDown
Identifies bars where the value area completely encompasses both the higher and lower boundaries of the previous bar’s value area. This engulfing pattern demonstrates significant expansion in trading activity and often signals strong momentum shifts, institutional participation, or major market sentiment changes that can lead to sustained directional moves.
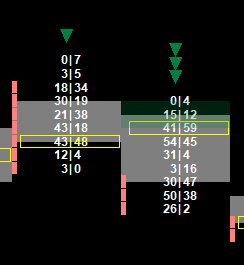
GapUpTop, GapUpBottom, GapDownTop, GapDownBottom,
VolumeDeclineBullishTop, VolumeDeclineBullishBottom, VolumeDeclineBearishTop, VolumeDeclineBearishBottom,
Detects progressively weakening volume at bar extremes across 3 consecutive price levels. In bullish bars, examines the lowest 3 bid price levels for declining bid volume toward the extreme low. In bearish bars, analyzes the highest 3 ask price levels for declining ask volume toward the extreme high.
The configurable Volume Decline Threshold (default: 1.5x) sets the multiplication factor required between price levels to confirm the decline pattern. This pattern often indicates absorption at key levels or diminishing pressure at price extremes, suggesting potential support/resistance formation.
RetailSuckUp, RetailSuckDown,
In a green bar volume decline in the bottom 3 Bid price levels. In a red bar volume decline in the top 3 Ask price levels.
DeltaTailUp, DeltaTailDown,
In a red bar, the only ask price level volume greater than the horizontal bid volume is the top Ask price volume. In a green up bar, the only bid price level volume greater than the horizontal ask volume is the bottom bid price volume.
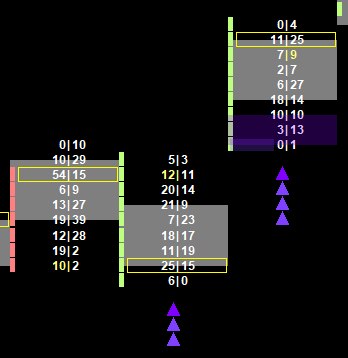
OpenPocUp, OpenPocDown,
Identifies Point of Control levels that break through previous price ranges using configurable lookback analysis (default: 5 bars). In bearish bars, the POC falls below the lowest lows of the previous N bars. In bullish bars, the POC exceeds the highest highs of the previous N bars.
This pattern indicates significant volume concentration at new price extremes, often signaling institutional interest and potential continuation of the breakout direction as major participants establish positions beyond previous trading ranges.
ValueAreaIslandUp, ValueAreaIslandDown
Identifies isolated value areas that are separated from previous price action, often marking reversal points.
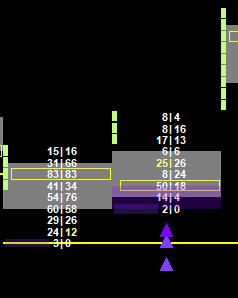
MomentumBullish, MomentumBearish
Identifies potential exhaustion points when bar edges approach a configured momentum line (such as Bollinger Band middle line, VWAP, or moving average). In bullish bars, the low must be close to and above the momentum line. In bearish bars, the high must be close to and below the line.
The configurable distance threshold (default: 3 ticks) determines how close the bar edge must be to the momentum line. This pattern helps identify when price approaches dynamic support/resistance levels with potential for exhaustion and reversal, particularly effective when combined with volume analysis and order flow patterns.
PocPopBullish, PocPopBearish
For a bullish Point of control pop, the green next bar contains a POC level below the low of the red bar. For a bearish Point of control pop, the red next bar contains a POC level above the high of the green bar.
AccumulationBullish, DistributionBearish
In a green bar, there is accumulation if the largest volume of any of the price levels in the bar is on the Bid side. In a red bar, there is distribution when the largest volume is on the Ask side.