Calculated Values Study
Subgraphs
MarketWeaknessBullish MarketWeaknessBearish
Identifies weakening market conditions through declining delta patterns over 3 consecutive bars. For bearish signals, all 3 bars must show positive delta with the 3rd bar moving opposite to the trend direction. For bullish signals, all 3 bars must show negative delta with the 3rd bar reversing against the downtrend. This pattern indicates potential exhaustion and possible reversal points.
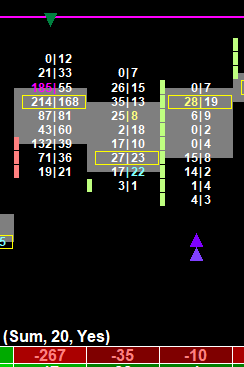
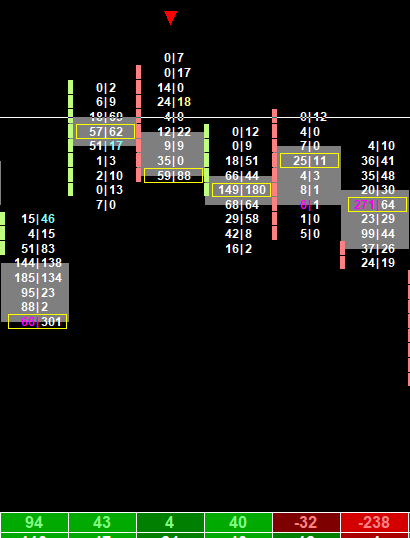
ExtremeDeltaVolumeThresholdBullish ExtremeDeltaVolumeThresholdBearish
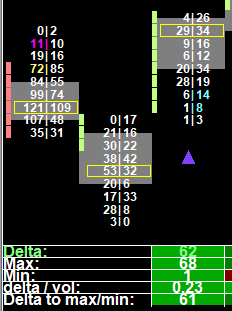
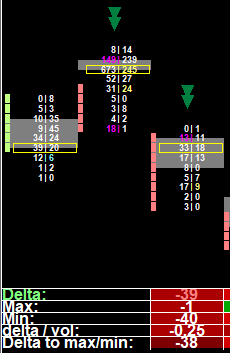
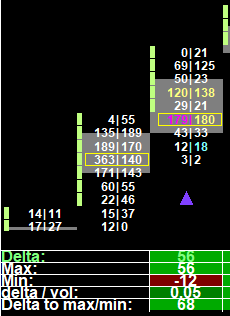
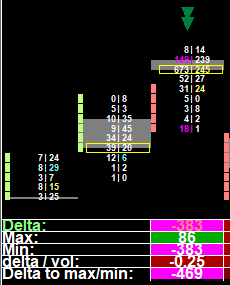
Detects extreme order flow dominance when delta-to-volume ratio exceeds 25%. This indicates exceptionally strong buying or selling pressure relative to total volume, suggesting significant institutional activity or market imbalance that often precedes strong directional moves.
PriceActionDivergenceBullish PriceActionDivergenceBearish
SmallMinDeltaBullish SmallMaxDeltaBearish
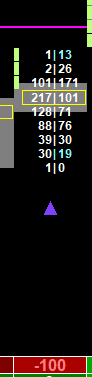
Identifies bars with minimal delta control where neither buyers nor sellers gained dominance (configurable threshold, default: 3). Small min/max delta values indicate balanced order flow and potential consolidation, often occurring at support/resistance levels or during market indecision phases.
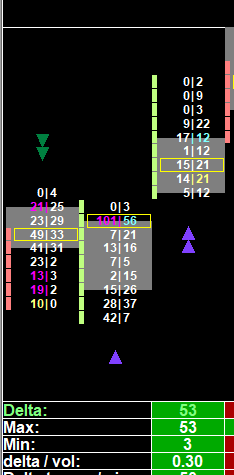
ExtremeDeltaThresholdBullish ExtremeDeltaThresholdBearish
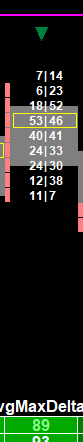
Delta value is within 95% of max or min bar delta.
DeltaDivergenceBullish DeltaDivergenceBearish
Classic divergence pattern where price action contradicts delta flow. Bearish: new/equal highs on red bars with negative delta (selling dominance). Bullish: new/equal lows on green bars with positive delta (buying dominance). These divergences often signal potential trend reversals as order flow contradicts price direction.
RatioUp RatioDown
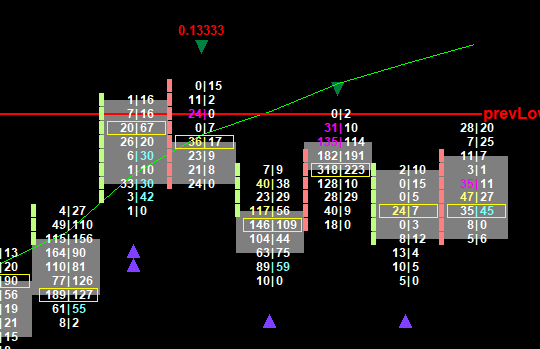
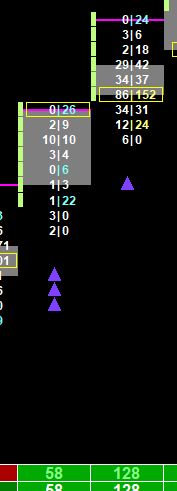
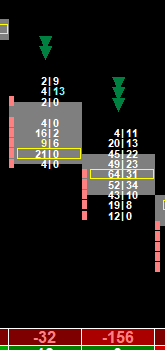
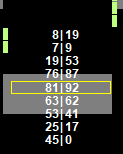
In a red bar, the top ask and 2nd slot ask price volume divided. In a green bar, the bottom bid and 2nd slot bid price volume divided. Only ratio values in a certain configurable range are displayed. Ratio Bounds high typically is market rejection while ratio bounds low is price defense. Swing high/lows are more poweful with ratios. A ratio number after a trend might signal the end.
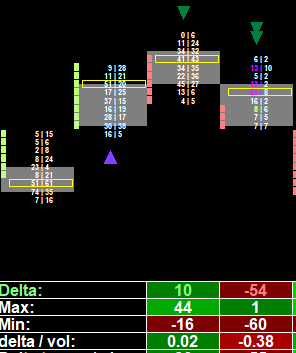
DeltaTransitionBullish DeltaTransitionBearish
Identifies significant shifts in delta patterns using lookback analysis (default: 20 bars). Compares current min/max delta values against historical averages, requiring both values to exceed the strength factor threshold (default: 1.2x). Signals potential trend transitions when order flow characteristics change substantially.
DeltaBreakoutBullish DeltaBreakoutBearish
Detects significant increases in delta from the previous bar, indicating momentum acceleration. The configurable threshold (default: 50) determines the minimum delta increase required. These breakouts often signal the beginning of strong directional moves as order flow intensity increases.
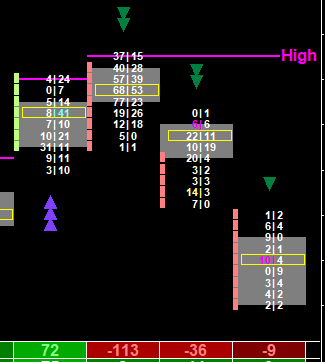
AboveAbove
BelowBelow
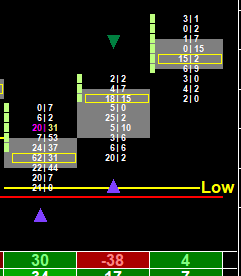
A green bar, where open and closing price levels are above the Point of Control. A red bar, where open and closing price levels are below the Point of Control.